359 prompts · Updated daily · 100% free

AI Prompt Library

Curated image, video and web design prompts from creators around the world. Copy any prompt, swap the subject or style, and generate with the latest models.

37 prompts

Infographic / Edu Visual - Product Reference Sheet Workflow
Nano Banana Pro

Infographic / Edu Visual - Product Reference Sheet Workflow

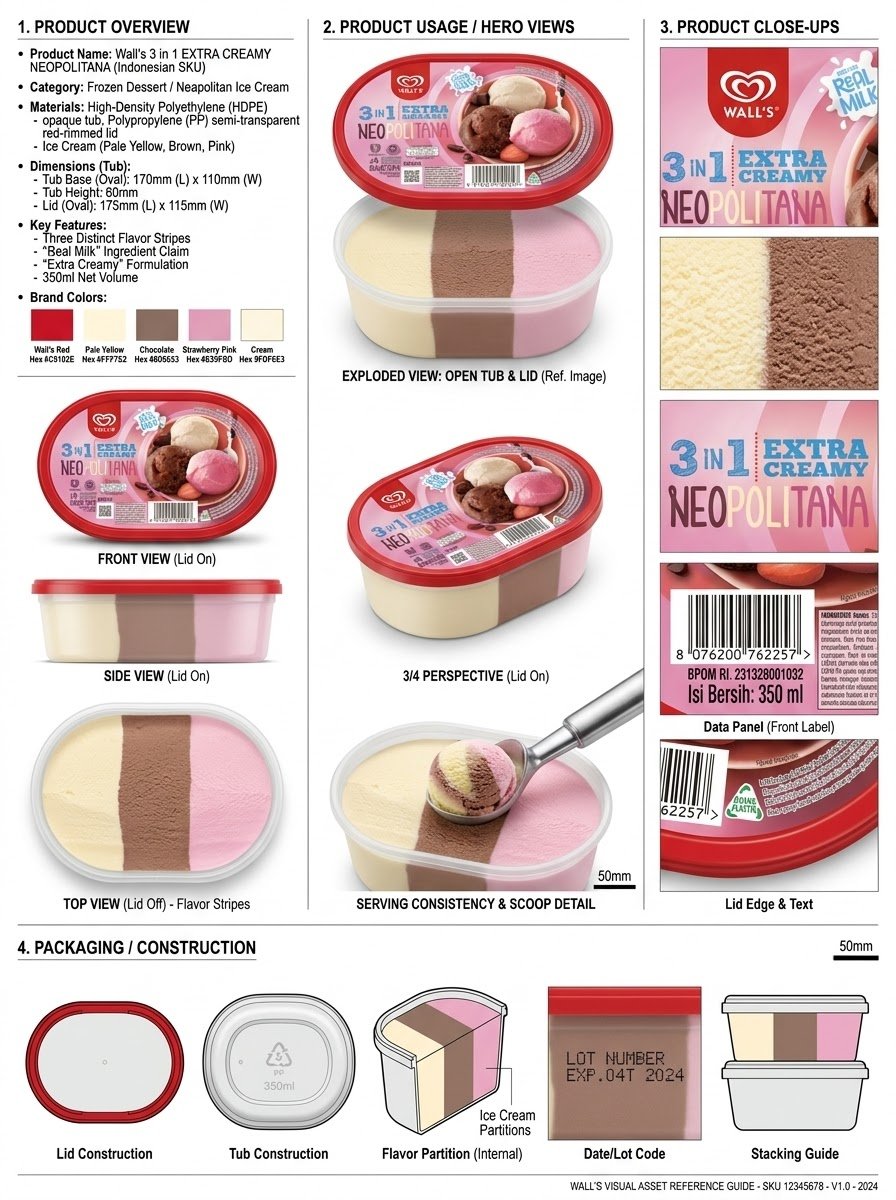
Analyze the product and create a high-resolution, photorealistic, professional advertising reference sheet containing these four sections, on a clean white/neutral studio background, premium commercial product photography, soft controlled lighting, realistic materials, sharp details, subtle shadows, and a professional editorial grid. 1. PRODUCT OVERVIEW; name, category, materials, dimensions/size, key features, and brand colors. 2. PRODUCT USAGE/HERO VIEWS - front, back, side, 3/4, and functional/use view where relevant. 3. PRODUCT CLOSE-UPS - logo/label, texture/material, key components, packaging details, and other important identifying features. 4. PACKAGING / CONSTRUCTION - relevant packaging or structural views where applicable. The entire sheet must function as a visual continuity bible for AI image/video production. Every product view must depict the exact same physical product with absolute consistency. Do not redesign, add variants, alter branding, or change proportions. Use cean typography, clear section labels, thin dividers, balanced spacing, sophisticated production-design aesthetic.
@Olatunde AI
Infographic / Edu Visual - Whimsical Coloring Page Illustration
Nano Banana Pro

Infographic / Edu Visual - Whimsical Coloring Page Illustration

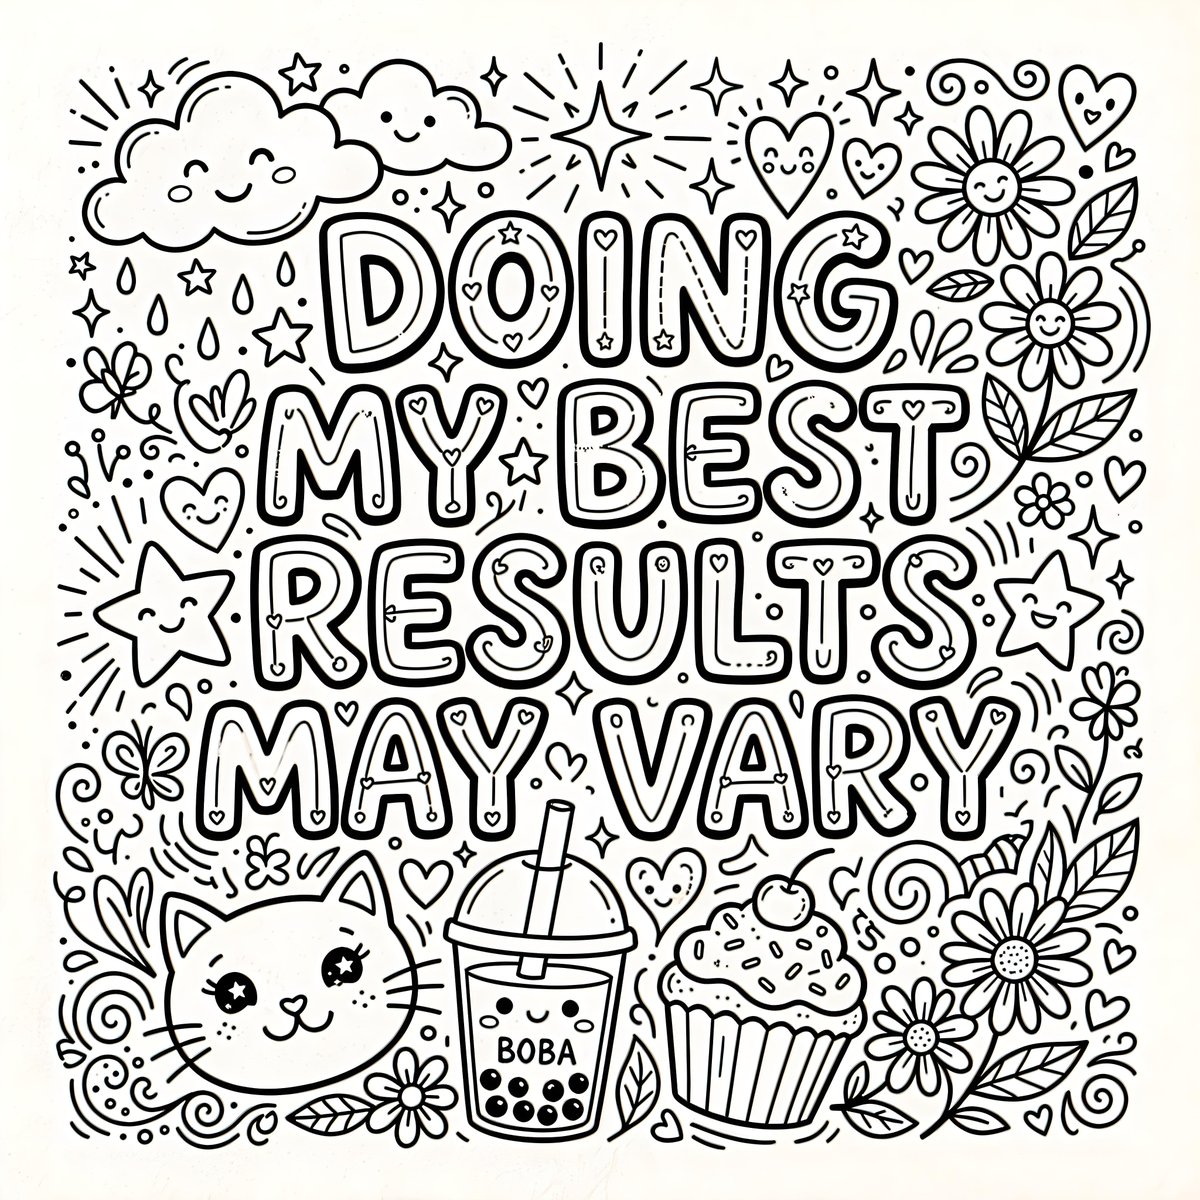
A black and white line drawing features the text "{argument name="quote" default="DOING MY BEST RESULTS MAY VARY"}" in large, bold, bubble-style lettering. The text is surrounded by various cute and whimsical elements, including smiling stars, a cat face, clouds, daisies, hearts, cupcakes, a boba tea, and sparkly starbursts. The overall composition is dense and playful, designed as a coloring page.

@Heather Green
Infographic / Edu Visual - Professional Beef Taco Product Photography
Nano Banana Pro

Infographic / Edu Visual - Professional Beef Taco Product Photography

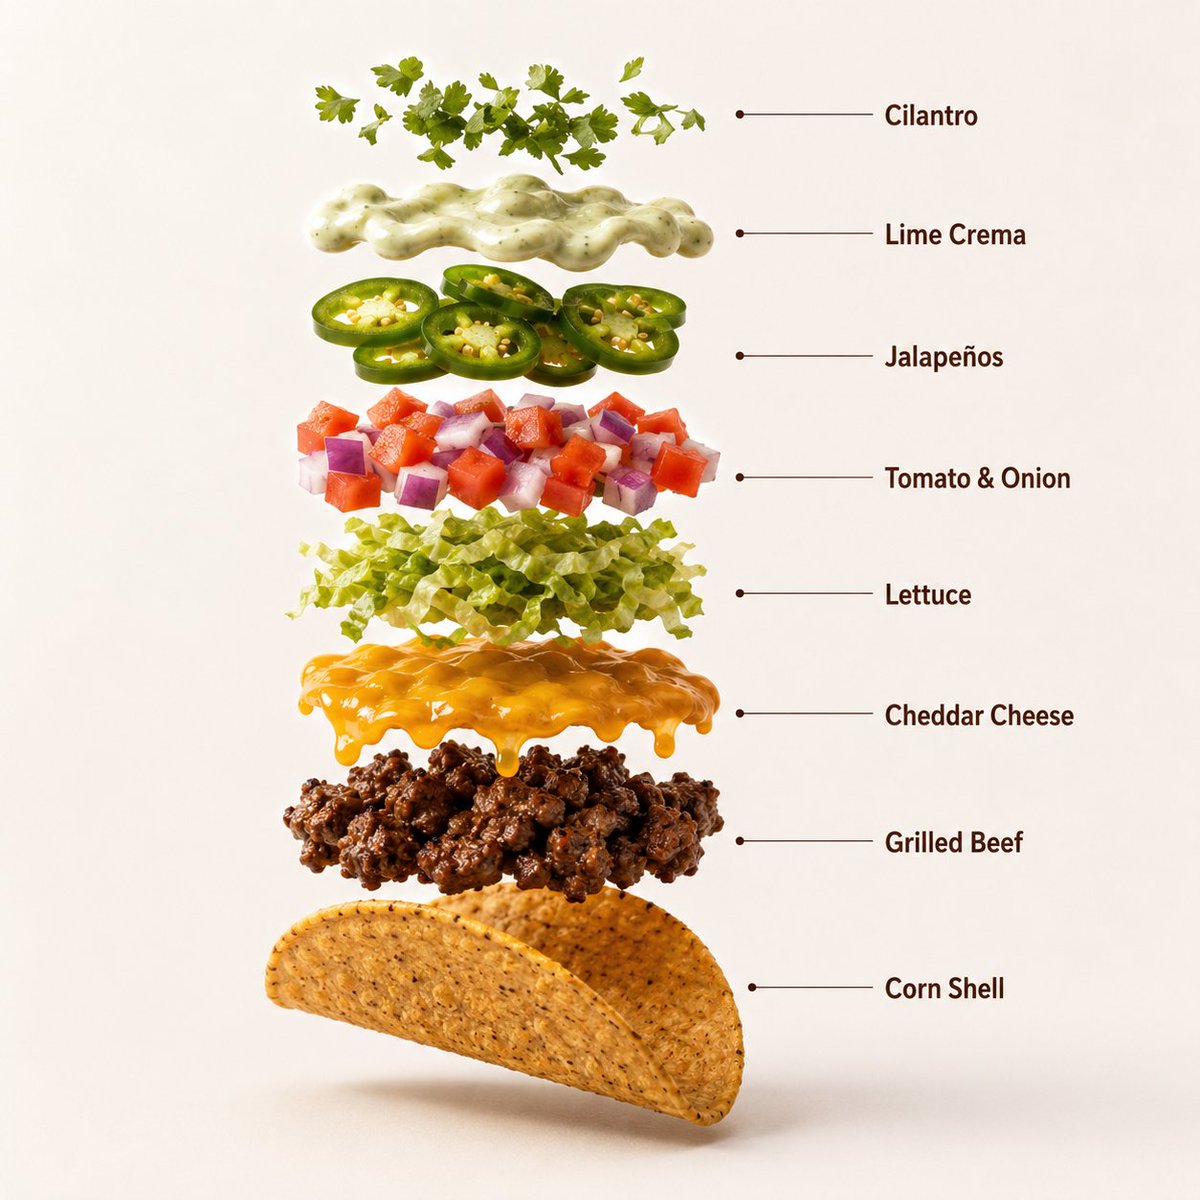
A high-quality professional product photograph of three premium loaded beef tacos arranged neatly on a dark ceramic plate, centered against a warm terracotta-orange seamless studio background. Each taco features a crisp golden corn shell filled with juicy seasoned grilled beef, melted cheddar cheese, fresh shredded lettuce, diced tomatoes, purple onions, jalapeño slices, and creamy lime sauce. The beef has realistic grilled texture and subtle char marks, while the vegetables appear fresh and vibrant with natural moisture. Soft cinematic studio lighting creates rich highlights and subtle shadows beneath the plate. Ultra-sharp focus, DSLR macro food photography, premium Mexican fast-food advertisement style, hyper realistic, clean commercial composition, 8K. Aspect Ratio: 1:1 Create a hyper-realistic exploded vertical infographic composition of a premium loaded beef taco. Top → Bottom structure: Fresh Cilantro Garnish → Lime Crema → Jalapeño Slices → Diced Tomato & Onion → Shredded Lettuce → Melted Cheddar Cheese → Seasoned Grilled Beef → Crispy Corn Shell Every element must be perfectly centered, evenly spaced, and aligned vertically. Show realistic grilled beef texture, melted cheese, crisp vegetables, fresh herbs, creamy sauce, and a detailed crunchy corn shell. Use a warm terracotta-orange seamless studio background, soft commercial lighting, subtle realistic shadows beneath every floating element, ultra-sharp DSLR macro food photography, premium fast-food infographic aesthetic, clean professional composition, hyper realistic, 8K. Add clean minimalist infographic text labels with thin pointer lines using these exact labels: "Cilantro" "Lime Crema" "Jalapeños" "Tomato & Onion" "Lettuce" "Cheddar Cheese" "Grilled Beef" "Corn Shell" Aspect Ratio: 1:1 The tacos start to slowly spin while the ingredients separate gently and precisely, maintaining alignment and scale. The motion is smooth, appetizing, and controlled with no extra effects.

@𝐌
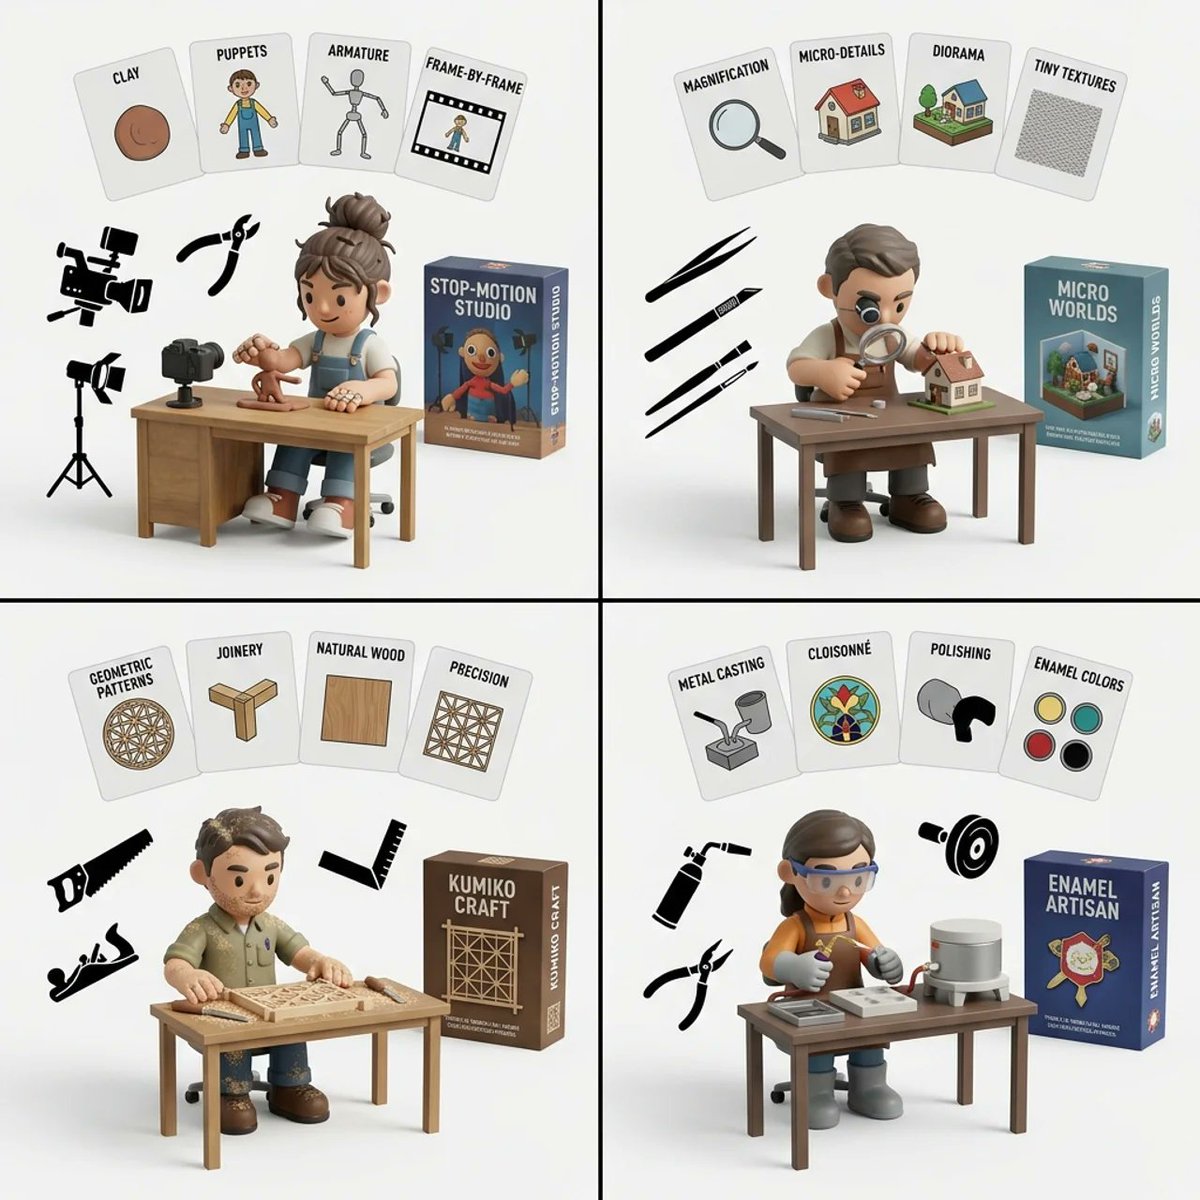
Handmade Art Style Visualizer Grid

Handmade Art Style Visualizer Grid

2x2 grid, do this for 4 hardest type of handmade art style 1. infer the 4 most common artistic motifs of {argument name="art style" default="[art_style]"}. generate them as 2d flat cards floating at the top of the image with text labels. 2. infer the typical fashion, hairstyle, and tattoo coverage of an artist who specializes in {argument name="art style" default="[art_style]"}. 3. generate a 3d vinyl toy character matching this fashion, sitting at a wooden desk drawing. 4. infer the specific tools used to create {argument name="art style" default="[art_style]"}. generate them as flat 2d black silhouettes floating in the air. 5. generate a 3d product box in the background matching the theme. 6. render all on a clean white studio background. execute.

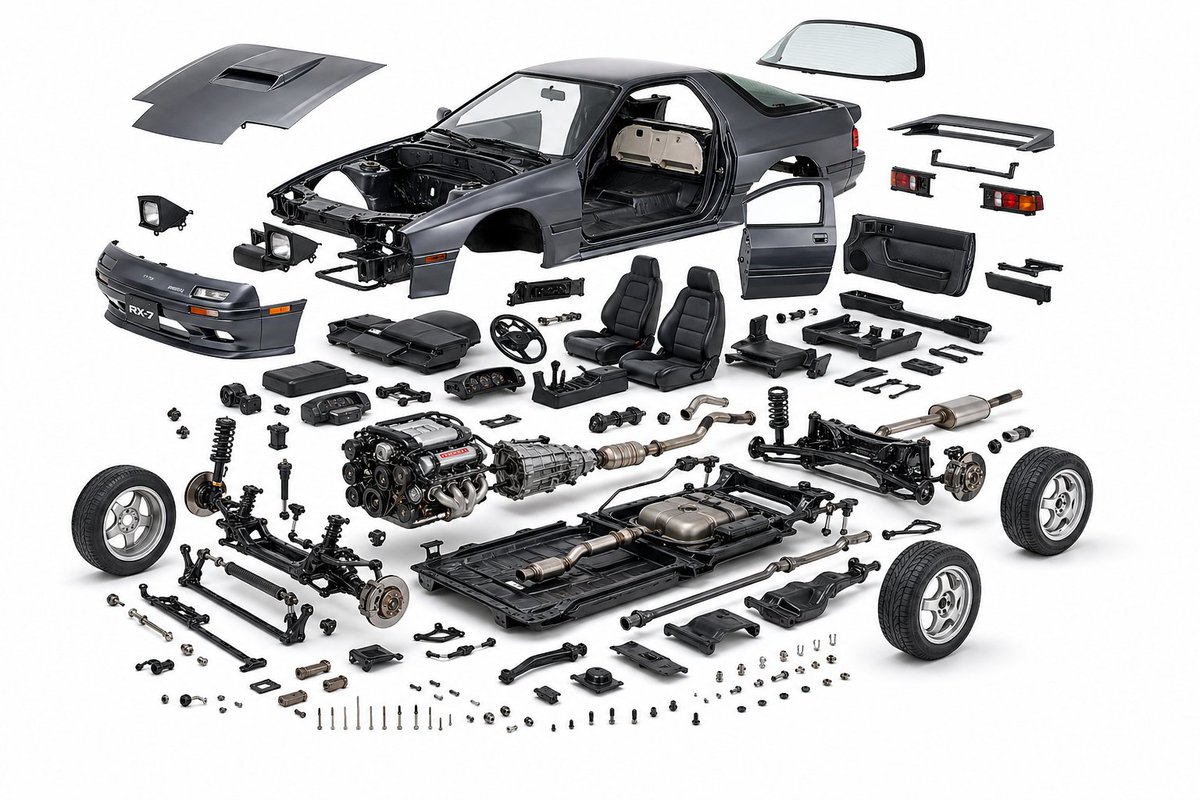
Exploded View Product Diagram Prompt

Exploded View Product Diagram Prompt

create a product design, {argument name="object" default="mazda rx7 fc3s"}, exploded view diagram, white background, three-dimensional, highly detailed internal components, studio lighting, product photography, best quality

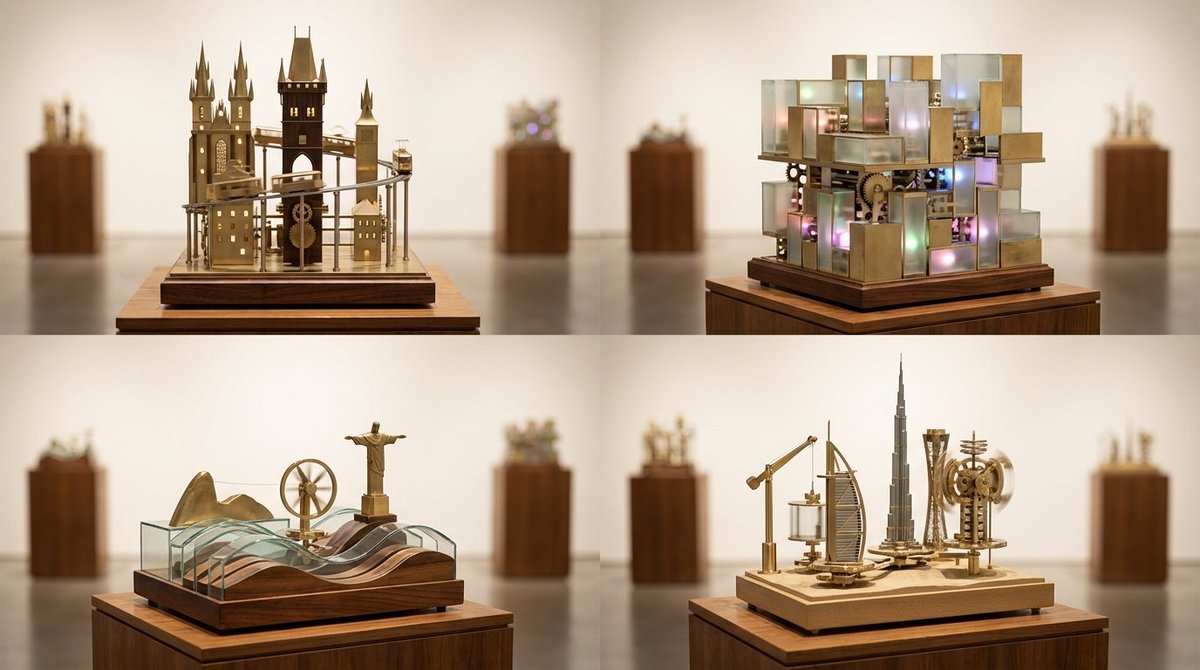
Cities as Kinetic Sculptures Grid

Cities as Kinetic Sculptures Grid

A 2x2 grid of 4 random famous cities turned into looping kinetic sculptures on museum plinths [Top Left: random real European city as a vertical kinetic skyline with moving trams and tiny lights] [Top Right: random real Asian megacity as a multi-layered kinetic light grid with sliding blocks] [Bottom Left: random real coastal city with rolling wave mechanisms and rotating landmarks] [Bottom Right: random real desert or inland city with lifting arms and spinning towers] Photoreal miniature kinetic sculptures made of brass, glass, and polished wood, subtle motion implied by blurred rods and tracks, illuminated display plinths in a gallery setting, soft museum lighting, gentle reflections on the floor, 60mm perspective for elegant compression, shallow depth of field isolating each sculpture, warm white seamless backdrop, crisp focus on intricate mechanics.

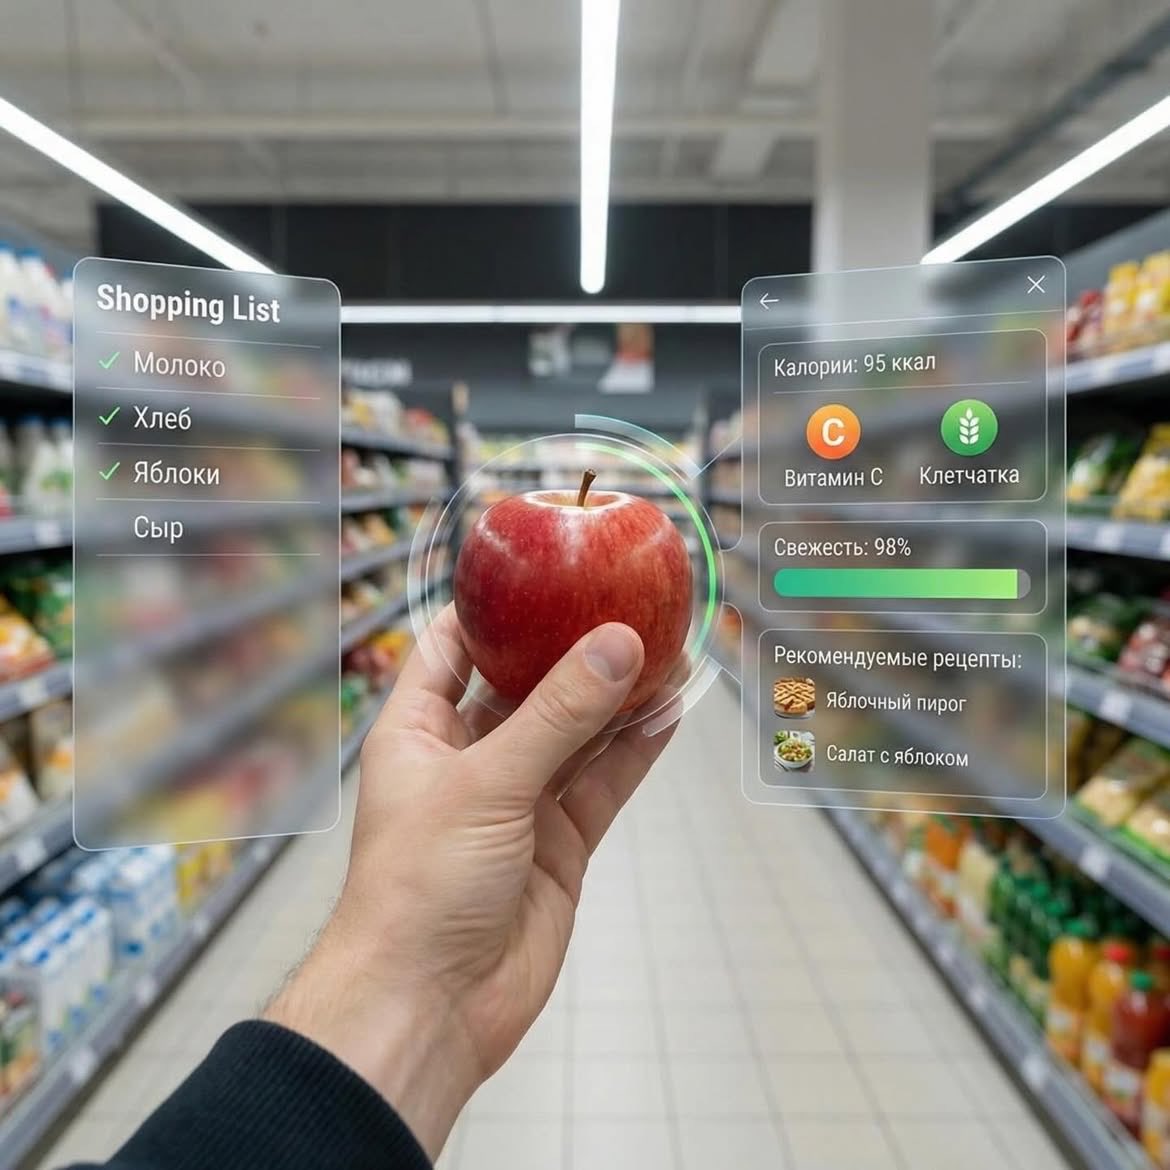
Augmented Reality UI Overlays on Food Items

Augmented Reality UI Overlays on Food Items

Dessert (AR shopping UI) POV shot inside a modern supermarket aisle, hands holding a small gourmet dessert with cream and berries, futuristic augmented reality (AR) interface overlay showing calories, sugar, fats, freshness score, expiry date, and recipe suggestions, soft depth of field, cinematic lighting, ultra-realistic, 4K, tech-inspired UI, clean glassmorphism design ⸻ 2. Apple (AR nutrition UI) First-person view in a grocery store holding a fresh red apple, augmented reality interface displaying calories, vitamin C, fiber, freshness bar, and recipe ideas, minimal futuristic UI panels floating around the object, bright supermarket lighting, shallow depth of field, hyper-realistic, modern tech aesthetic, 4K ⸻ 3. Orange Soda Bottle (AR data UI) POV shot of hands holding an orange soda bottle in a supermarket aisle, futuristic AR overlay showing calories, sugar content, caffeine level, freshness score, expiry date, and drink recipes, sleek holographic interface, glassmorphism UI, vibrant colors, cinematic lighting, ultra-detailed, photorealistic, 4K

Typographic Sculpture of Historical Inventions

Typographic Sculpture of Historical Inventions

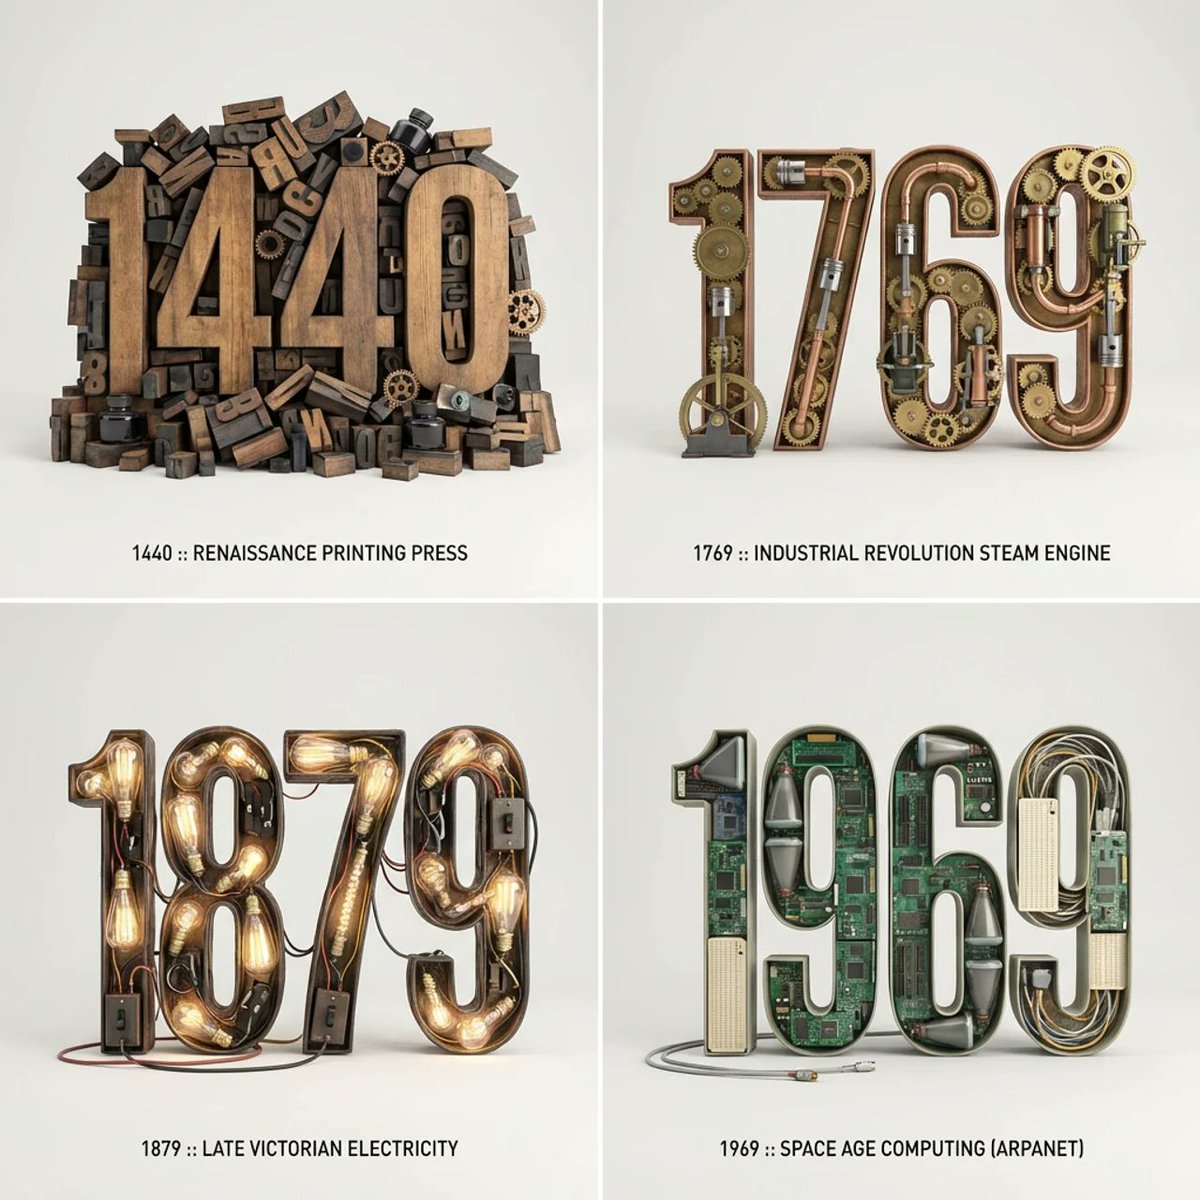
2x2 grid, do this for 4 important years in history and their most important inventions { Anchor: `[Letter/Number] :: [Era/Theme (e.g., 1980s Retro Tech / Victorian Steampunk)]::4` Morphology: `3D Typographic sculpture of [Letter/Number], character shape defined by a dense pile of [Era/Theme] objects, chaotic but legible assemblage, graphic design asset::3` Material Physics: `Textures of [Era/Theme] objects (plastic, rust, wood), occlusion between stacked items, realistic scale of constituent parts forming the glyph::3` Illumination: `Three-point studio lighting, softbox overhead, clean background for isolation::2` Render Stack: `Cinema 4D render, isometric or front-facing, ambient occlusion, 8k, Adobe Substance material suite::1` Negative: `[Illegible, flat font, 2D, handwriting, paper, messy background, floating objects]:: -1`}

3D Radial Explosion Product Visualization Prompt for Nano Banana 2

3D Radial Explosion Product Visualization Prompt for Nano Banana 2

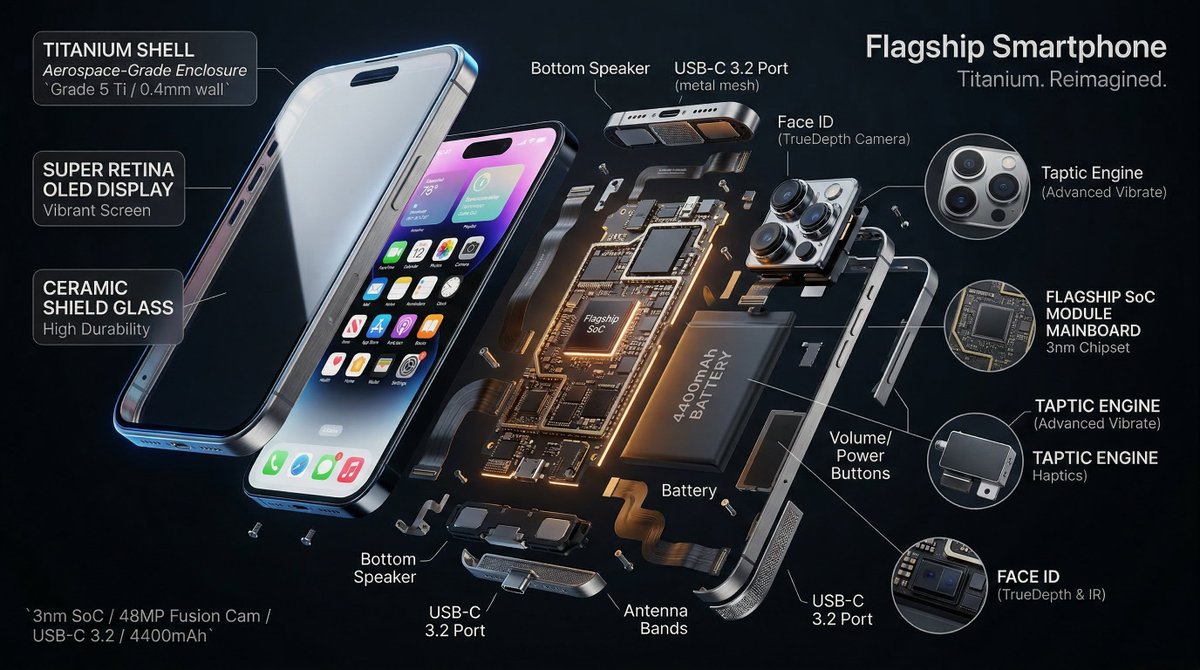
Hyperrealistic 3D radial exploded view of {argument name="product" default="PRODUCT"} {argument name="number of components" default="NUMBER"} components bursting outward from a central axis in every direction, frozen in mid-air. True spatial explosion, not a vertical stack, depth and parallax visible. COMPONENTS (core outward): {argument name="shell material" default="SHELL"} → DISPLAY → FRAME → MAINBOARD → BATTERY → MICRO PARTS shown in 3x floating callout circles MATERIALS: glass refracts and catches specular highlights, aluminium shows brushed grain and machined edges, PCB traces glow faintly amber, rubber gaskets matte with micro-texture, cables with soft bend physics. LABELS: hairline leader to floating box. "[COMPONENT]" uppercase / "[FUNCTION]" italic / "[KEY SPEC]" monospace. Radiate outward, no overlaps. LIGHTING: cool diffused overhead + warm amber underlighting on internals + thin blue rim on outer shell. Displays emit soft UI glow. Circuits self-illuminate. BACKGROUND: {argument name="background color" default="COLOR"}, deep, non-reflective. Midnight black recommended. TITLE: "[PRODUCT NAME]" top right. SUBTITLE: "[TAGLINE]". SPEC BLOCK: "[SPEC 1] / [SPEC 2] / [SPEC 3]" bottom left in monospace. Mood: iFixit teardown meets NASA manual meets WIRED cover. 4K, tack sharp, extraordinary material fidelity.

Atmospheric Product Interface Visual Prompt for SaaS UI

Atmospheric Product Interface Visual Prompt for SaaS UI

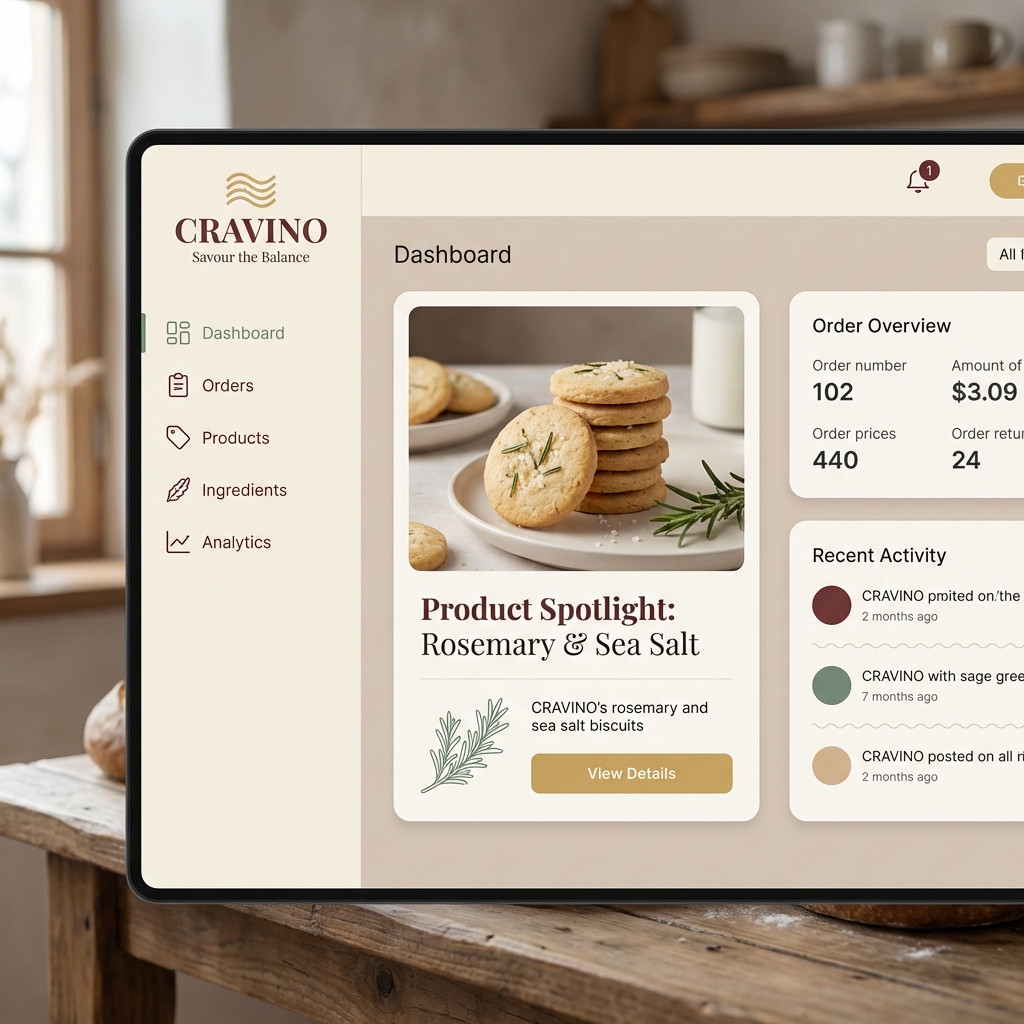
Atmospheric product interface visual for a modern SaaS platform. Clean hierarchy, balanced contrast, soft shadows, neutral color palette, focus on clarity and calm, designed like a best-in-class SaaS experience.

Newspaper Mid-Unfold Diorama Prompt

Newspaper Mid-Unfold Diorama Prompt

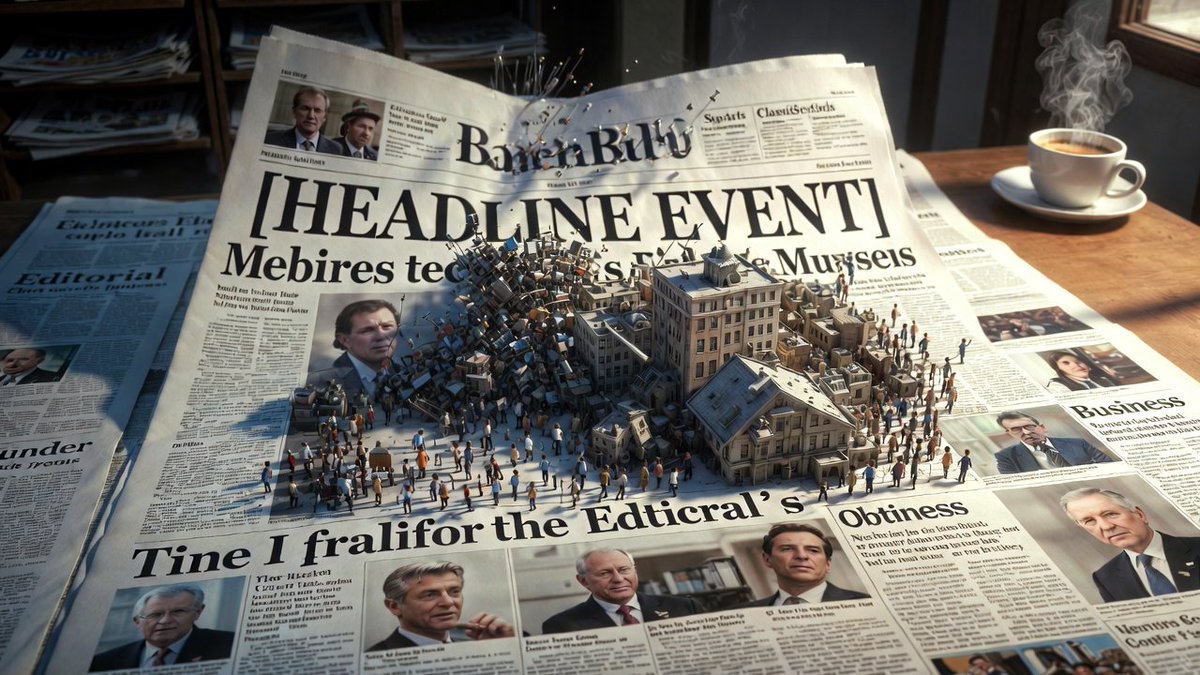
Epic 3D scene: a massive broadsheet newspaper mid-unfold, its headlines erupting into the events they describe. Front page stories become dioramas pushing off the page. {argument name="headline event" default="[HEADLINE EVENT]"} manifests in miniature chaos. Photographs animate and expand into three dimensions. Column text rises as city blocks of information. Editorial section becomes a battlefield of arguing figures. Classifieds transform into tiny desperate lives. Different sections occupy different worlds: sports as stadium, business as trading floor, obituaries as memorial garden. Yesterday's news composites beneath as fading ghost layer. Ink smells almost visible as atmosphere. Newsstand visible at the edge, morning light, coffee steam, 8K, photorealistic.

Expedition Planning Board Collage Prompt

Expedition Planning Board Collage Prompt

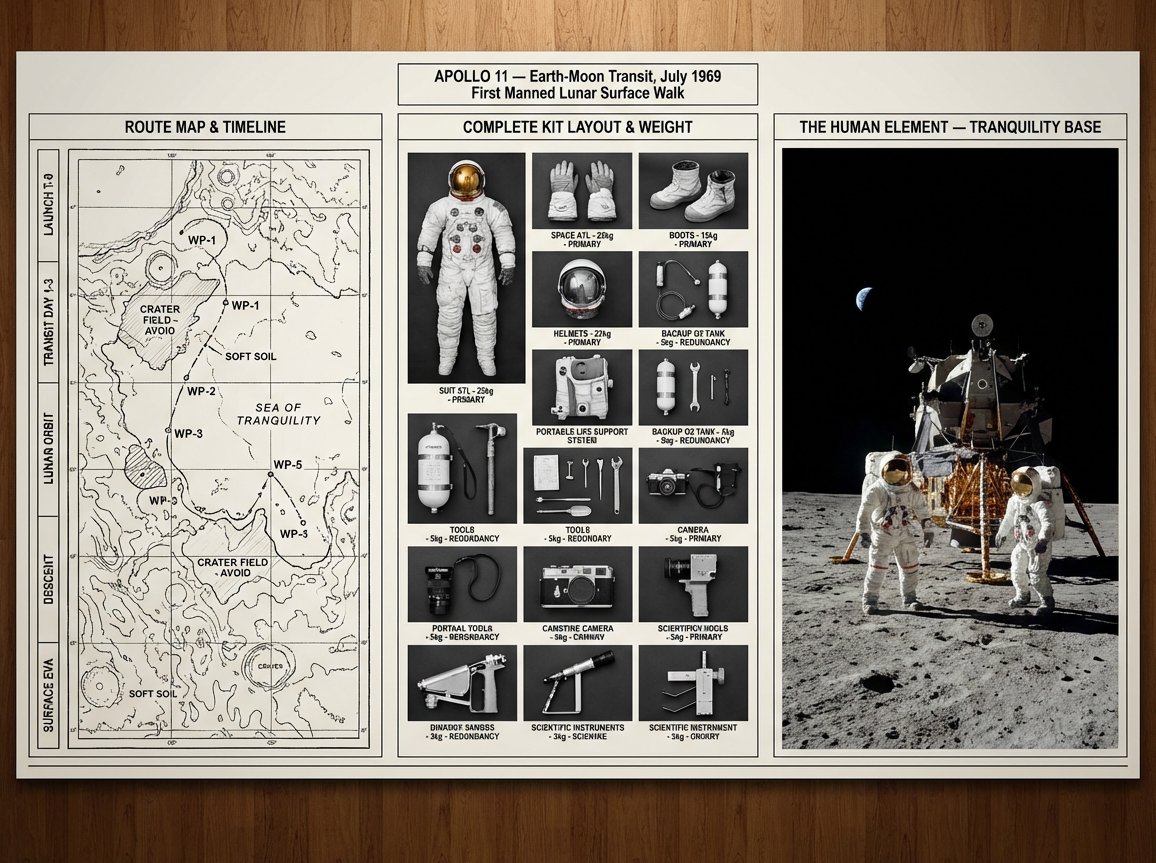
An expedition leader's planning board for {argument name="journey mission" default="[JOURNEY / MISSION]"} — {argument name="destination era" default="[DESTINATION / ERA]"}. Left section: route map with topographical detail, waypoints marked, danger zones annotated, and timeline running along the margin. Center section: complete kit layout, every piece of equipment photographed from above in organized rows, weight and function noted, redundancies highlighted, nothing extraneous. Right section: the expedition in progress or the destination achieved, figures in landscape, scale established, the human element against the immense. Visual style transitions from cartographic precision through utilitarian inventory to epic environmental photography. Title block reading "{argument name="expedition name" default="[EXPEDITION NAME]"} — [ROUTE], [DATE], [OBJECTIVE]".

Simplified Comparative Infographic Grid Generator Prompt (Legs and Stockings)

Simplified Comparative Infographic Grid Generator Prompt (Legs and Stockings)

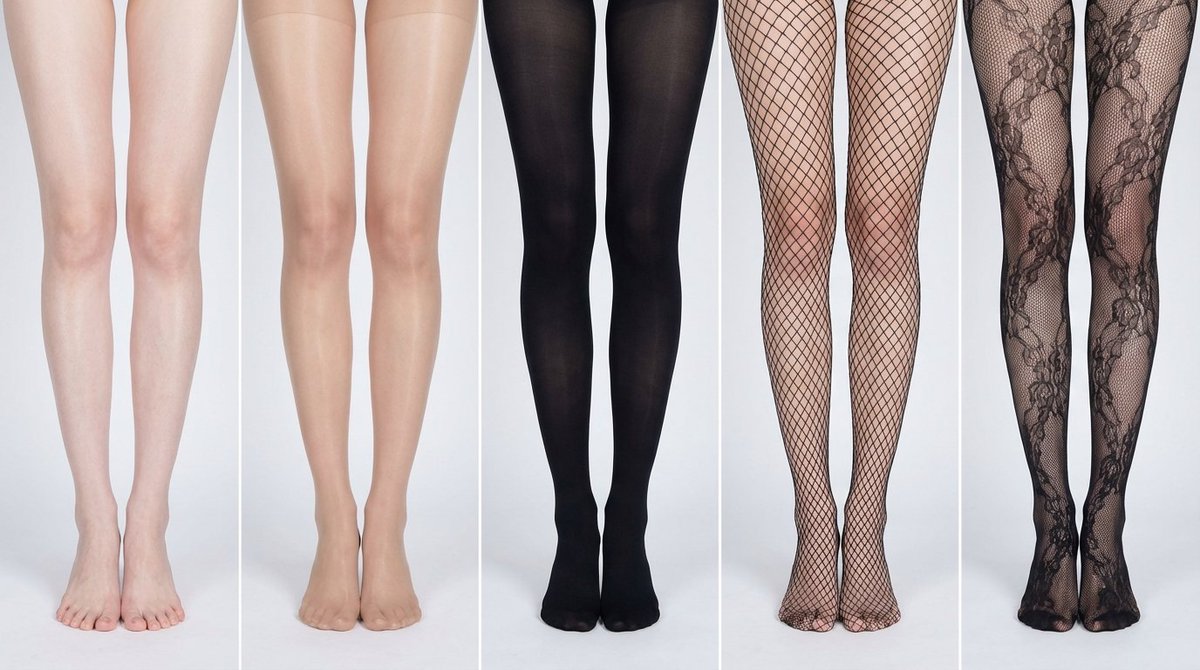
# Role: Comparison Infographic Generator (Design-Centric with Toggles) # === USER INPUT SETTINGS (FILL THESE IN) === # 1. Grid Size (e.g., "2x2 (4 panels)", "3x3 (9 panels)"): {argument name="grid size" default="1x5"} # 2. Base Subject Description (Identical base scene for all panels): [{argument name="subject description" default="Cold white, slender, fair Asian female legs, skin delicate and smooth, without blemishes, almost invisible pores and hair follicles. Skin is not dry, slightly moist"}] # 3. Variations Theme (What is being compared?): {argument name="variation theme" default="Comparison of bare legs with different stocking materials and styles"} The feet need to be fully displayed in the frame # 4. Show Text Overlay at Bottom (Yes/No): NO # =========================================== # Task Description: Generate a multi-panel infographic grid chart for a comparative visual study based on the User Input Settings above. The goal is to showcase different textural or stylistic variations (defined in the data list below) applied to the identical Base Subject defined above. # Global Constraints & Style: 1. **Layout:** A **[Insert setting from "1. Grid Size" here]** infographic grid chart. 2. **Consistency is Key:** The Base Subject, camera angle, composition, and lighting must remain absolutely identical across ALL panels to emphasize only the specific variations defined in the data list. 3. **Photography Style:** Clean, controlled studio photography with neutral, even lighting designed to highlight texture differences. # Text Overlay Display Logic (CONDITIONAL): (AI Instructions: First, check the value of User Input Setting "# 4. Show Text Overlay at Bottom". You MUST execute ONLY ONE of the following logic blocks based on that value.) ##### ➤ LOGIC PATH A: IF Setting #4 is "Yes" (Show Overlay) If the user selected "Yes", EVERY panel must feature a precisely designed text overlay at the bottom following these strict rules: * **Background:** A clean, sharply defined solid rectangular color block (e.g., charcoal grey or black) spanning the entire width of the panel's bottom section. * **Typography:** Inside this block, the text must be rendered in an **elegant, ultra-thin, minimalist sans-serif font**. * **Layout:** The text "[Number]. [Short Title] (Prompt: [Key English Prompt Snippet])" must be perfectly centered within the color block. * **Aesthetic:** The overall effect should be that of professional, minimalist graphic design, with crisp lines and perfect alignment. ##### ➤ LOGIC PATH B: IF Setting #4 is "No" (Hide Overlay) If the user selected "No", apply this CRITICAL rule: * **CRITICAL:** DO NOT add any text overlay, numbers, titles, background color blocks, or prompt snippets to the images. * **Result:** The bottom of every panel must be clean image data only, showing the subject fully without obstruction. # Base Subject Definition: The base scene for every panel is: **[Insert description from "2. Base Subject Description" here]**. The variations below will modify the surface or appearance of this base subject. # Variations Data List (Apply sequentially to the grid): (AI instructions: Iterate through this list based on the required grid size. For each panel, apply the user-defined 'Visual Change' to the base

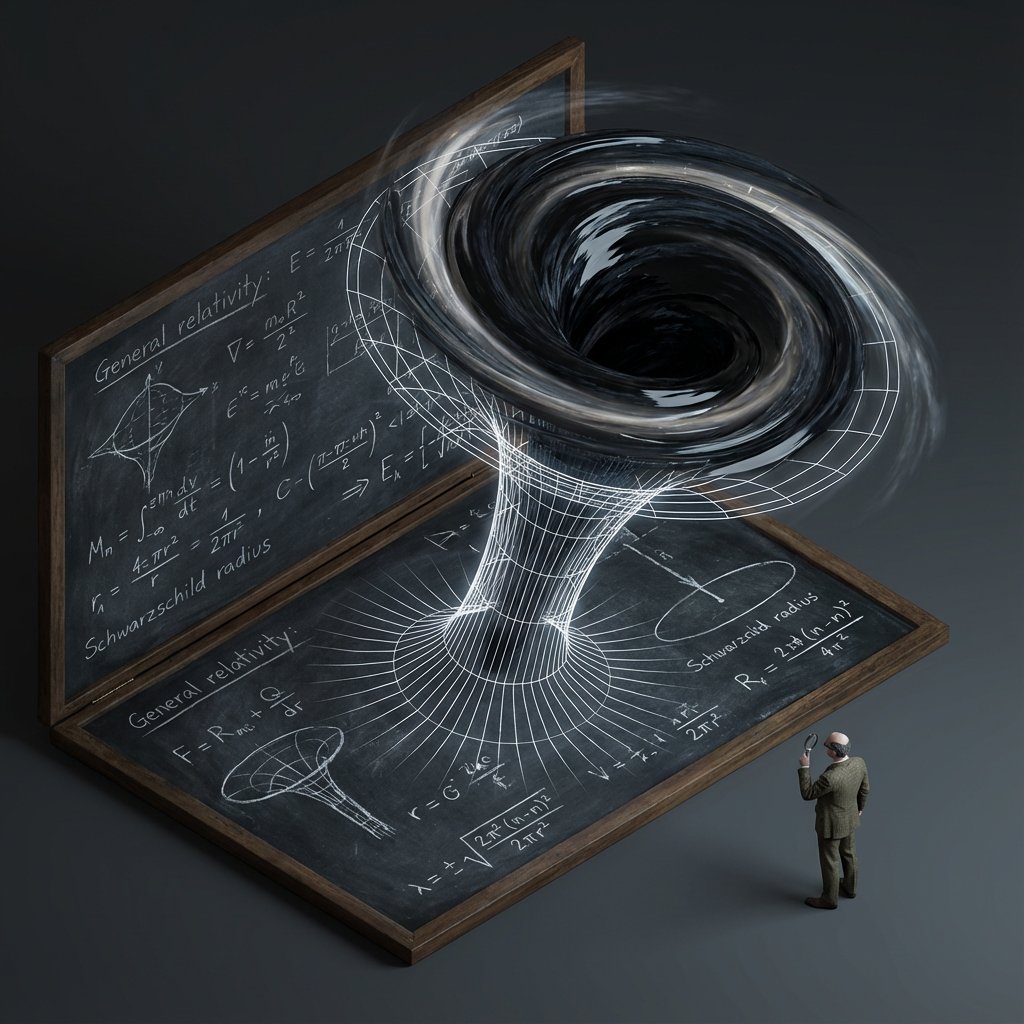
Scientific Theory Visualization Generator

Scientific Theory Visualization Generator

<instructions> do this for {argument name="scientific concept" default="black holes"} Input Variable: {argument name="theorem or formula" default="[Theorem / Formula]"} Phase 1: Schematic Decomposition Analyze the Notation: Identify the primary visual language of the scientist (Chalk on blackboard? Ink on parchment? Pencil on graph paper?). Identify the "Structure": If this theory were a building, what would it look like? Logic: Chaos Theory -> Fractal Spire. Thermodynamics -> Engine Block. Phase 2: The Dimensional Transition The Base: A flat surface covered in the [Notation Medium] (e.g., a slate blackboard covered in chalk equations). The Extrusion: The chalk lines physically lift off the surface. They begin as white wireframes, then gain opacity, then gain texture. The Climax: At the top of the image, the wireframes have fully solidified into a photorealistic, impossible structure representing the theory. The Observer: A tiny, scale-model figure of the scientist stands on the flat "2D" section, looking up in awe at the massive "3D" structure they have summoned. Output: High-Angle Isometric, "Architectural Visualization" style, stark contrast between sketchy lines and solid mass. </instructions>

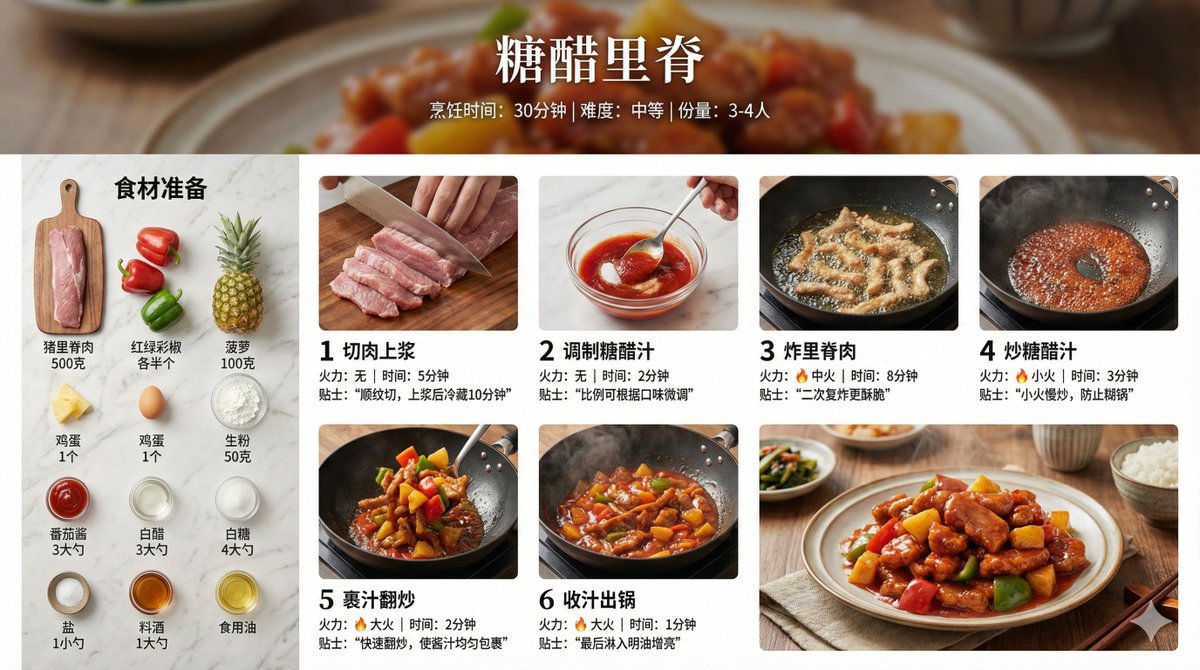
Infographic Prompt for Sweet and Sour Pork Recipe

Infographic Prompt for Sweet and Sour Pork Recipe

Create a home-style cooking step infographic for 【{argument name="dish name" default="Sweet and Sour Pork"}】. 【Overall Style】 - Style: 8K ultra-HD realistic photography style, professional quality suitable for a food magazine - Image Quality: 8K resolution, sharp details, professional food photography lighting - Background: Real kitchen scene/marble countertop/wooden cutting board, shallow depth of field blur - Color Palette: Natural and realistic colors, true colors of ingredients, warm lighting - Layout: Horizontal 16:9 【Top Title Area】 - Main dish title (elegant Chinese font) - Subtitle: Cooking time / Difficulty level / Serving size - Background can use a blurred close-up of the finished dish 【Left or Top - Ingredient List Area】 - Title: "Ingredient Preparation" - All ingredients arranged realistically, neatly organized from a top-down view (flat lay) - Each ingredient labeled with name and quantity - Style: Instagram-style ingredient flat lay photography 【Main Body - Cooking Steps Area】 - 6-8 steps, arranged in a grid or timeline - Each step includes:   * Step number (simple numeric identifier)   * Close-up photo of the actual cooking process:     - Cutting meat: Knife skills details, meat texture     - Blanching: Boiling water, foam     - Caramelizing sugar: Caramel color, oily sheen     - Stir-frying: Dynamic movement in the wok, flame     - Stewing/Simmering: Sauce bubbling, steam rising     - Reducing sauce: Thick sauce, glossy meat pieces   * Brief descriptive text (1-2 sentences)   * Heat/Time notation 【Bottom - Finished Dish Display Area】 - 8K high-definition photo of the finished dish - Professional plating, exquisite tableware - Shot at a 45-degree angle or top-down view - Visible food texture: Gloss of the sauce, fibers of the meat, rising steam - Background: Dining table setting, chopsticks, small side dishes for garnish 【Photography Specifications】 - Lighting: Side-back light/natural window light, creating appetite appeal - Depth of Field: Subject sharp, background naturally blurred - Texture: Visible ingredient texture, oil sheen, reflection of the sauce - Steam: Real steam visible in hot dish steps - Color Temperature: Warm tone (5500-6000K), enhancing appetite 【Auxiliary Elements】 - Tips notation: Key techniques (e.g., "Blanch in cold water to remove odor," "Simmer slowly for 40 minutes") - Heat icon: 🔥 notation for heat level in each step - Timer notation: Duration for key steps - All ingredient quantities, step details, time, and heat should be automatically generated accurately based on the dish

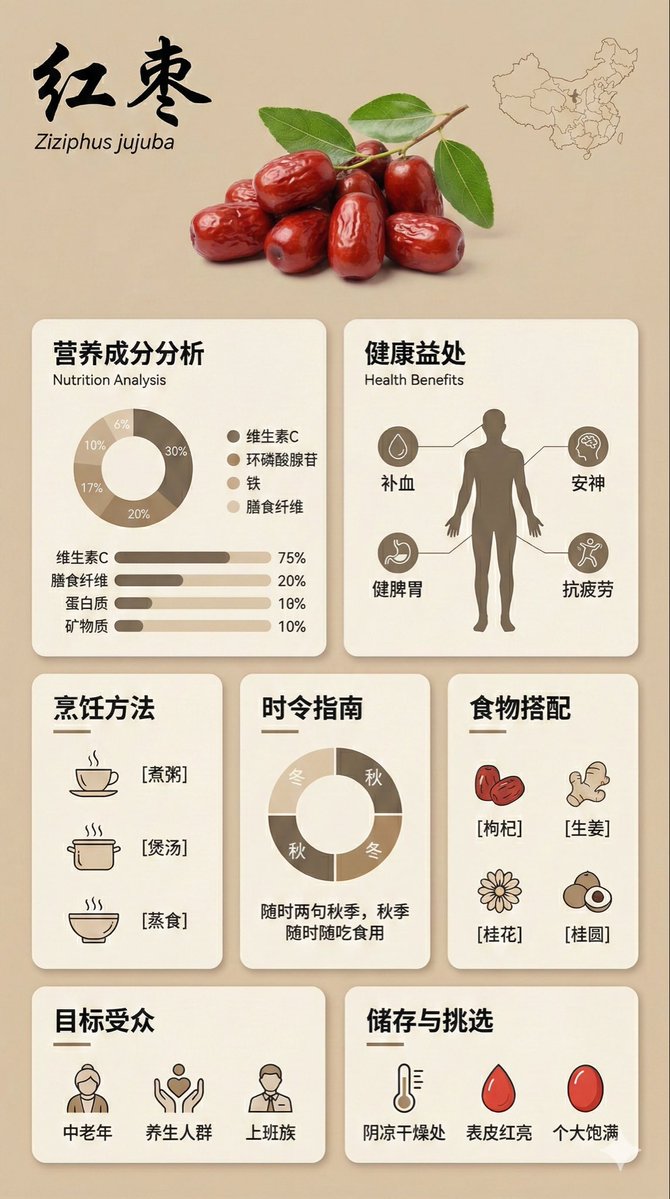
Bento Grid Infographic Prompt for Food Science

Bento Grid Infographic Prompt for Food Science

{ "image_analysis": { "subject": "Infographic about {argument name="ingredient name" default="Goji Berry"}, 9:16", "style": "Modular Bento Grid Design / Minimalist UI Design", "tone": "Professional, warm, high-end, educational", "primary_colors": ["Beige", "Cream", "Dark Brown", "Warm Earth Tones"] }, "prompt_elements": { "subject_description": "A high-quality educational infographic poster about {argument name="ingredient name" default="Goji Berry"}.", "layout": "Bento box style modular grid layout, clean UI/UX interface design, divided into clear rectangular cards.", "visual_details": [ "Top header with a striking, elegant Chinese calligraphy title 'Ingredient Chinese Name' and its scientific name", "Center top features a hyper-realistic photographic image of [visual description of fresh ingredient]", "A small outline map of [origin/country] in the corner", "Section 1: Nutritional analysis with donut charts and bar charts, percentages indicating proportions", "Section 2: Human silhouette diagram showing health benefits with connecting lines", "Section 3: Cooking method matrix with minimalist line icons ([Cooking Method 1], [Cooking Method 2], [Cooking Method 3])", "Section 4: Seasonal consumption guide with circular charts", "Section 5: Food pairing grid with simple icons ([Pairing 1], [Pairing 2], [Pairing 3])", "Section 6: Target audience profile icon", "Section 7: Storage and selection guide with temperature and weather icons" ], "art_style": "Minimalist graphic design, soft vector illustrations combined with product photography, flat design icons, clean typography.", "lighting": "Soft diffused studio lighting, shadowless and flat lay aesthetic.", "color_palette": "Monochromatic warm beige background, off-white cards, dark brown and charcoal grey text, soft accents." "negative_prompt": "Cluttered, neon colors, messy layout, low resolution, blurry, distorted text, 3D rendering, dark background, chaos, oversaturated, watermark" }

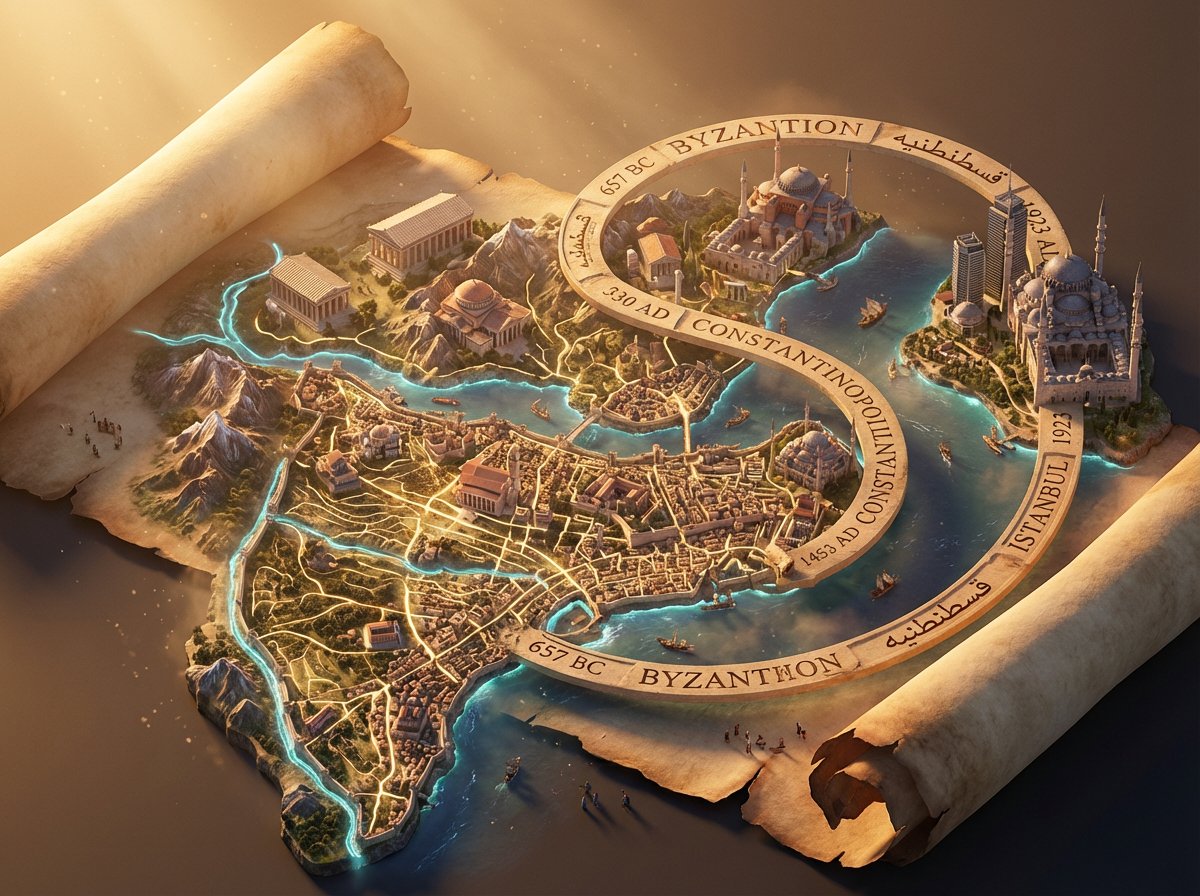
3D Isometric Atlas Scene in Firefly Style

3D Isometric Atlas Scene in Firefly Style

Epic 3D isometric atlas scene: a massive ancient map of {argument name="subject" default="[SUBJECT]"} erupts from an unfurled parchment scroll, filling nearly the entire frame. Ink lines ignite into living terrain: mountain ranges push upward, cities rise in vertical layers, rivers glow and flow, borders burn softly in gold. Multiple civilizations {argument name="civilization layers" default="[CIVILIZATION LAYERS]"} coexist in stacked time, their architectures phasing through one another as if time is folding. A carved timeline spirals across the map with engraved dates. All text in {argument name="language" default="[LANGUAGE]"}. Extreme scale contrast, dense micro-detail everywhere, dramatic golden-hour light, volumetric dust, cinematic depth, 8K, UE5.

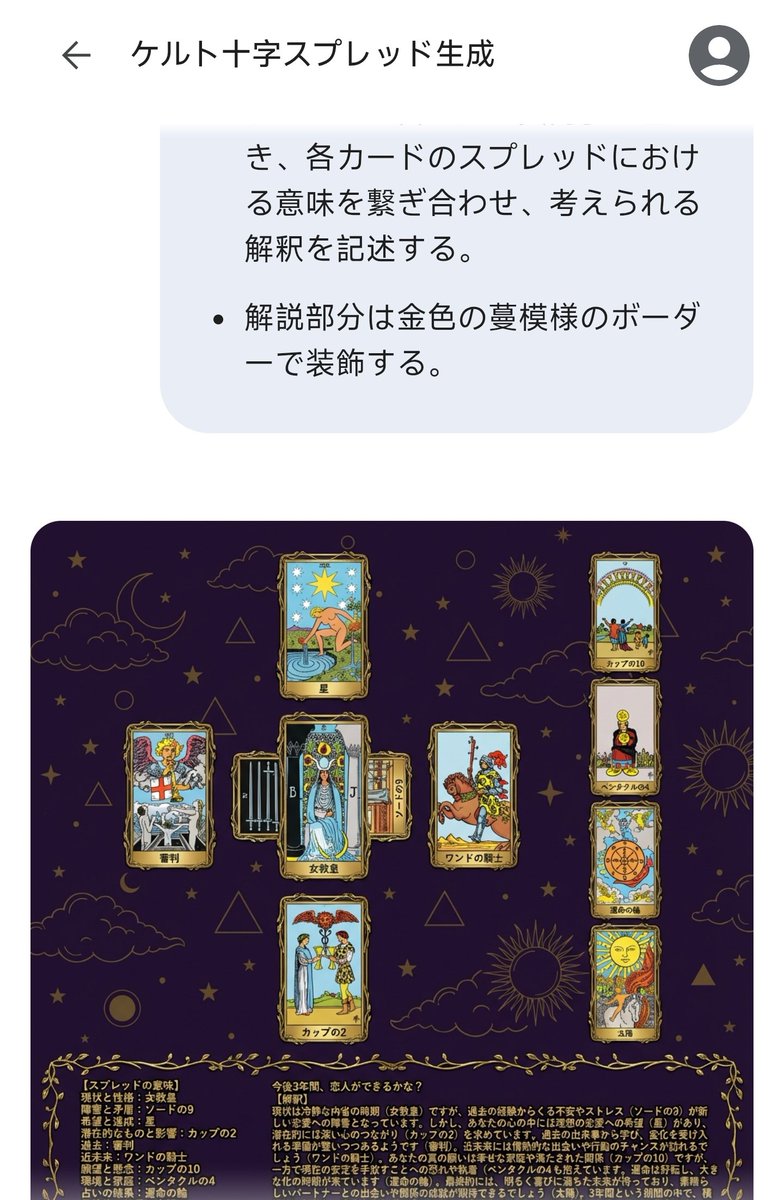
Tarot Celtic Cross Spread Reading Generation Prompt

Tarot Celtic Cross Spread Reading Generation Prompt

# Generate Results for the Celtic Cross Spread ## Fortune-Telling Parameters - Card indicating the essence of the problem: {argument name="card essence of problem" default="(Fill in 1 card from 78 cards)"} - Question to be asked: {argument name="question to ask" default="(Describe in one sentence)"} ## Image Requirements ### Canvas Settings - 2048*2048px 2K image - Cards and text elements must be at least 20px away from the canvas edges - The card layer should be placed horizontally centered and in the upper 2/3 vertically - The text layer (explanation section) should be placed in the lower 1/3 vertically ### Background Layer - Dark purple background with dark gold stars, clouds, moon, sun, and lines of circles and triangles added to create a mystical atmosphere ### Card Layer - Use all 78 standard Tarot cards. Breakdown: 22 Major Arcana (from "The Fool" to "The World") and 56 Minor Arcana (4 suits: Wands, Cups, Swords, Pentacles). - Each Minor Arcana suit includes number cards 1 through 10 and 4 Court cards. - The edges of the cards are framed with golden metallic vines, and the inside depicts the corresponding image and the name in Japanese. The size of each card is unified and arranged so as not to be cramped. To ensure the text and images of the overlapped cards are visible, the short side (bottom and top edges) of the card should be 1/2 the length of the long side. - Each extracted card must appear only once. If duplication occurs during random extraction, redraw a different card. - Exclude the card specified in "Fortune-Telling Parameters - Card indicating the essence of the problem," and extract the spread from the remaining cards. - Extract 1 card randomly, placed vertically in the center. - Extract 1 card randomly, placed horizontally in the center (with the top of the card facing left), overlapping the vertical center card to form a cross. - Extract 1 card randomly for each position (Up, Down, Left, Right) surrounding the central cross. - Extract 4 cards randomly in a vertical column on the right side. ### Meaning of the Spread - Center, vertical: Current situation and personality - Center, horizontal: Obstacles and contradictions - Up: Hopes and achievements - Down: Potential and influence - Left: Past - Right: Near future - Right column, 1st card: Wishes and concerns - Right column, 2nd card: Environment and family - Right column, 3rd card: Result of the reading - Right column, 4th card: Final outcome ### Text Layer - Use Mincho font, dark gold color, with a 2px black border (#000). - Card Name: Display the name in Japanese at the bottom center of each generated card image. For horizontally placed cards, the name should be displayed at the bottom of the card itself (not the bottom relative to the horizontal placement). - Explanation Section: Include the following content in the explanation section. - On the left side of the explanation section, list all extracted cards in the format: "[Meaning of the Spread] Card Name". - On the right side of the explanation section, describe the possible interpretation by connecting the meaning of each card in the spread, based on the "Fortune-Telling Parameters - Question to be asked". - Decorate the explanation section with a golden vine pattern border.

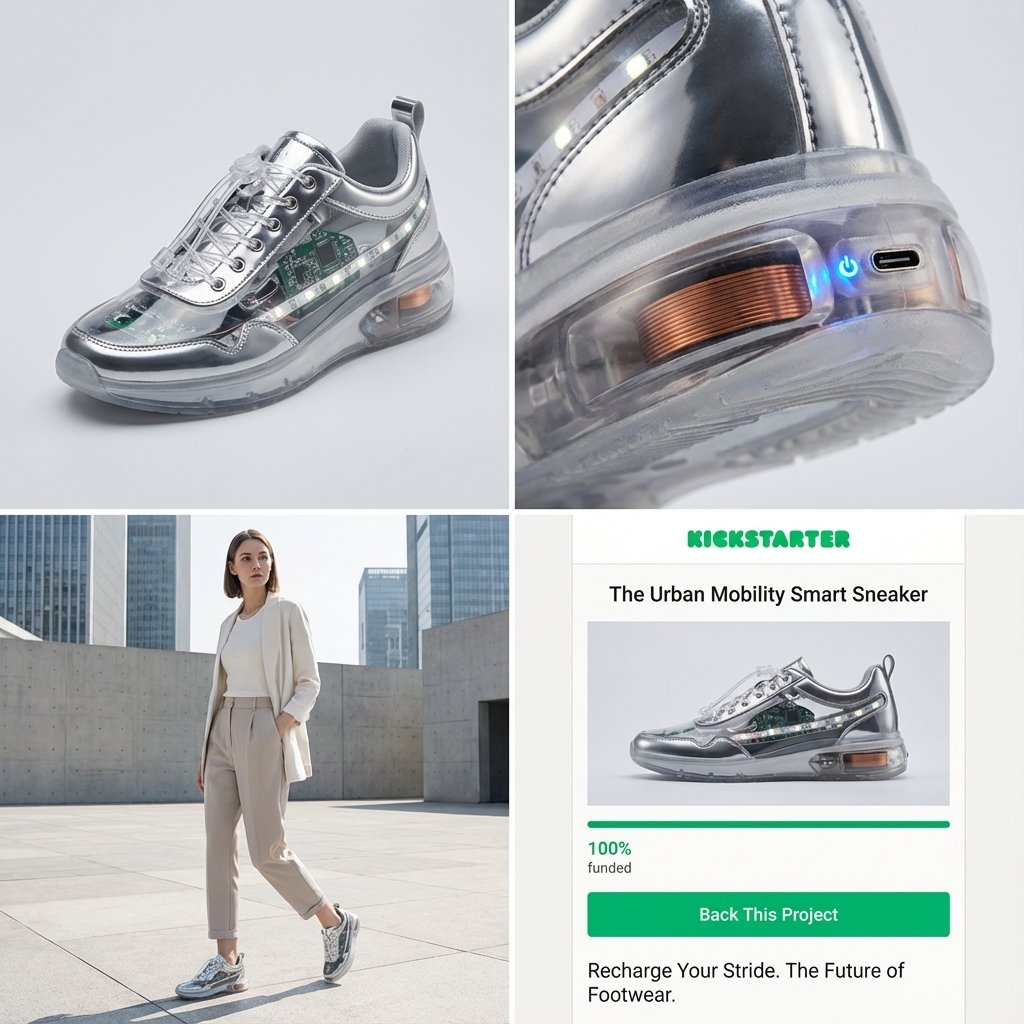
Kickstarter Campaign Generator Prompt

Kickstarter Campaign Generator Prompt

Act as a Senior Product Designer and Crowdfunding Campaign Manager. 1. ANALYZE INPUT Look at the attached image. Determine the material properties (Soft vs. Hard), the primary colors, and the texture. 2. AUTO-SELECT SMART WEARABLE Use this logic to choose the product category. The goal is Clean Modern Tech, not Cyberpunk. IF the input is Soft or Fabric-like ({argument name="soft input examples" default="Ramen, Towel, Moss"}) GENERATE: The All-Climate Smart Jacket. Features: Self-regulating temperature control, hydrophobic coating based on the input texture, and hidden magnetic pockets. IF the input is Rigid, Boxy, or Container-like ({argument name="rigid input examples" default="Toaster, Book, Suitcase"}) GENERATE: The Ultimate Commuter Backpack. Features: Integrated power bank with solar coating, anti-theft biometric zipper locks, and organized modular compartments. IF the input is Mechanical or Footwear-shaped ({argument name="mechanical input examples" default="Stapler, Car, Tool"}) GENERATE: The Urban Mobility Smart Sneaker. Features: Energy-returning sole technology, step-tracking sensors embedded in the heel, and auto-tensioning laces. 3. EXECUTE VISUALIZATION (2x2 GRID) Generate a single image split into a precise 2x2 grid layout. Top Left Panel (Hero Shot): A clean, studio-lit 3/4 angle view of the product on a white or light grey background. It must look refined and manufacturable, using the texture of the input image as a premium material. Top Right Panel (Detail Shot): A zoomed-in macro shot focusing on a specific high-tech feature (e.g., a USB-C port, a magnetic buckle, or a waterproof seam) that shows off the input texture quality. Bottom Left Panel (Lifestyle Shot): A photorealistic shot of a fashionable model wearing the item in a clean, modern city setting (daytime). They look comfortable and stylish. Bottom Right Panel (Campaign UI): A mockup of a Kickstarter campaign page. It should show the product title, a green progress bar at 100% funded, and a bright green button that says Back This Project. Overall Style: High-key lighting, soft shadows, 8k resolution, commercial product photography, minimalist design aesthetic.
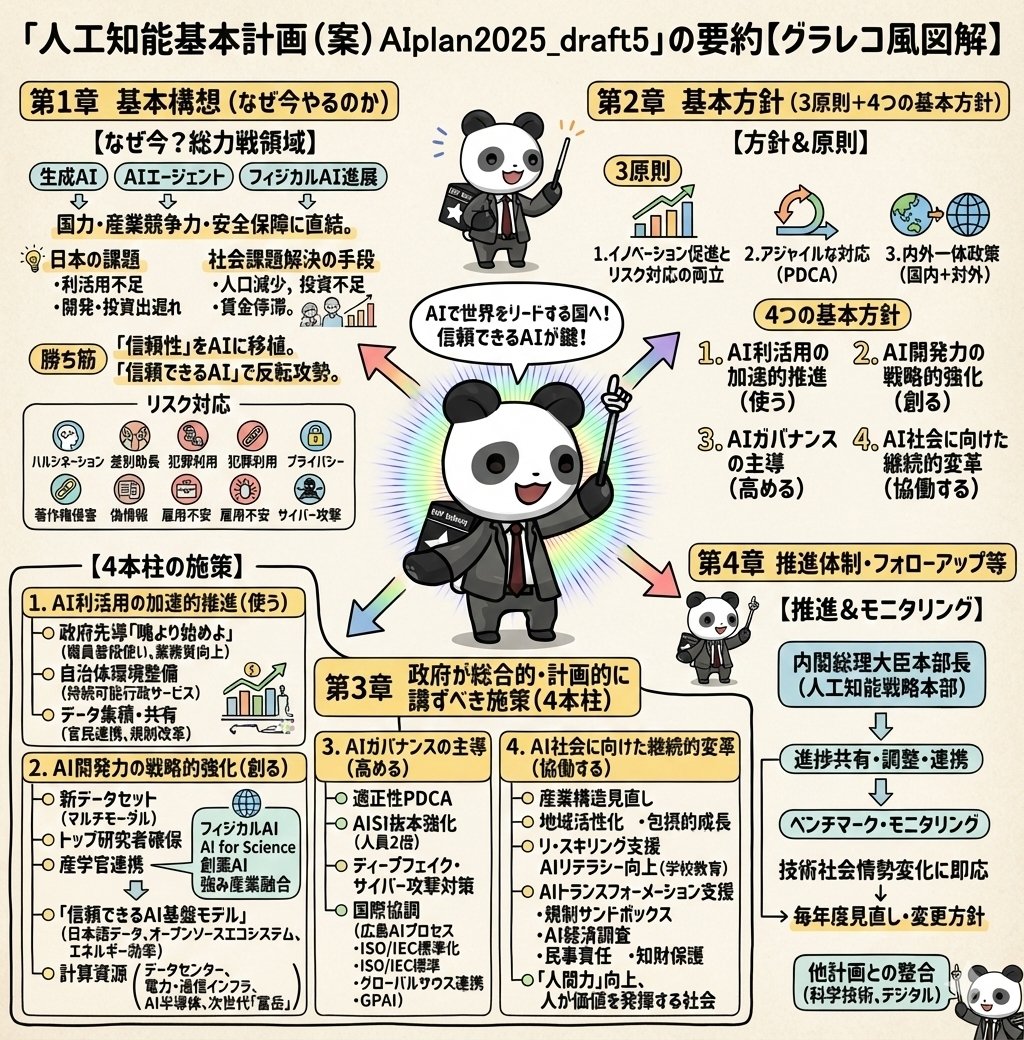
Detailed Japanese Graphic Recording Summary

Detailed Japanese Graphic Recording Summary

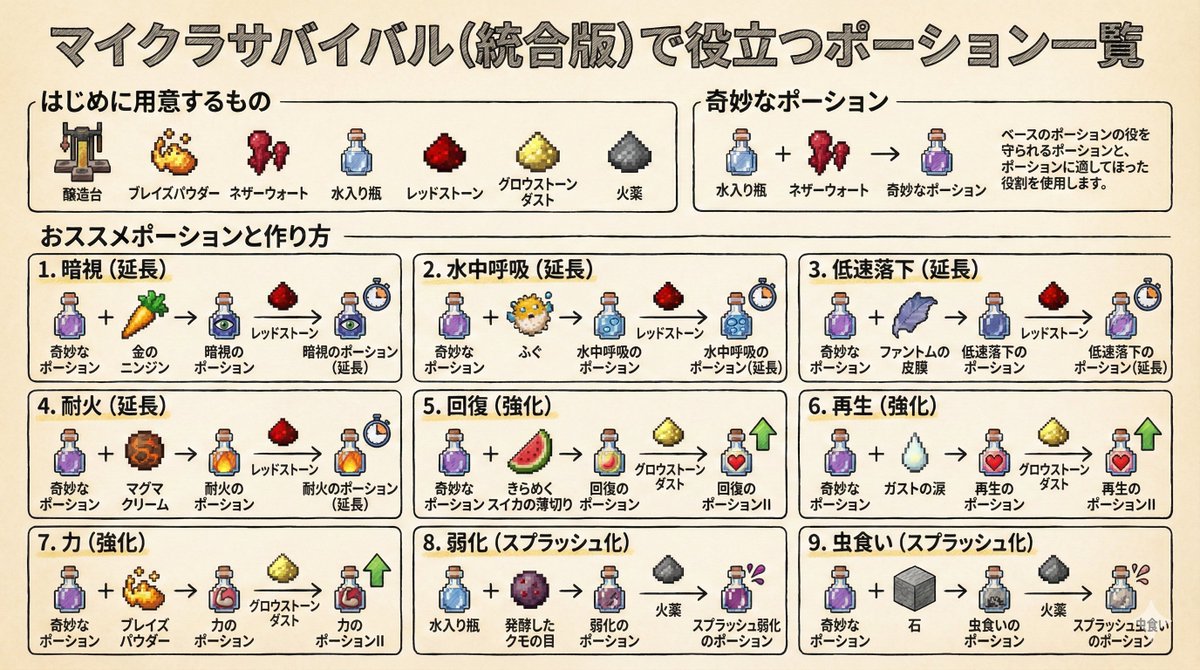
Illustrate this content in detail in Japanese. Make it in a graphic recording style. Make it truly ultra-detailed, even if the text is small. Use the attached image for the character.

Culinary Periodic Table Display Board Generator

Culinary Periodic Table Display Board Generator

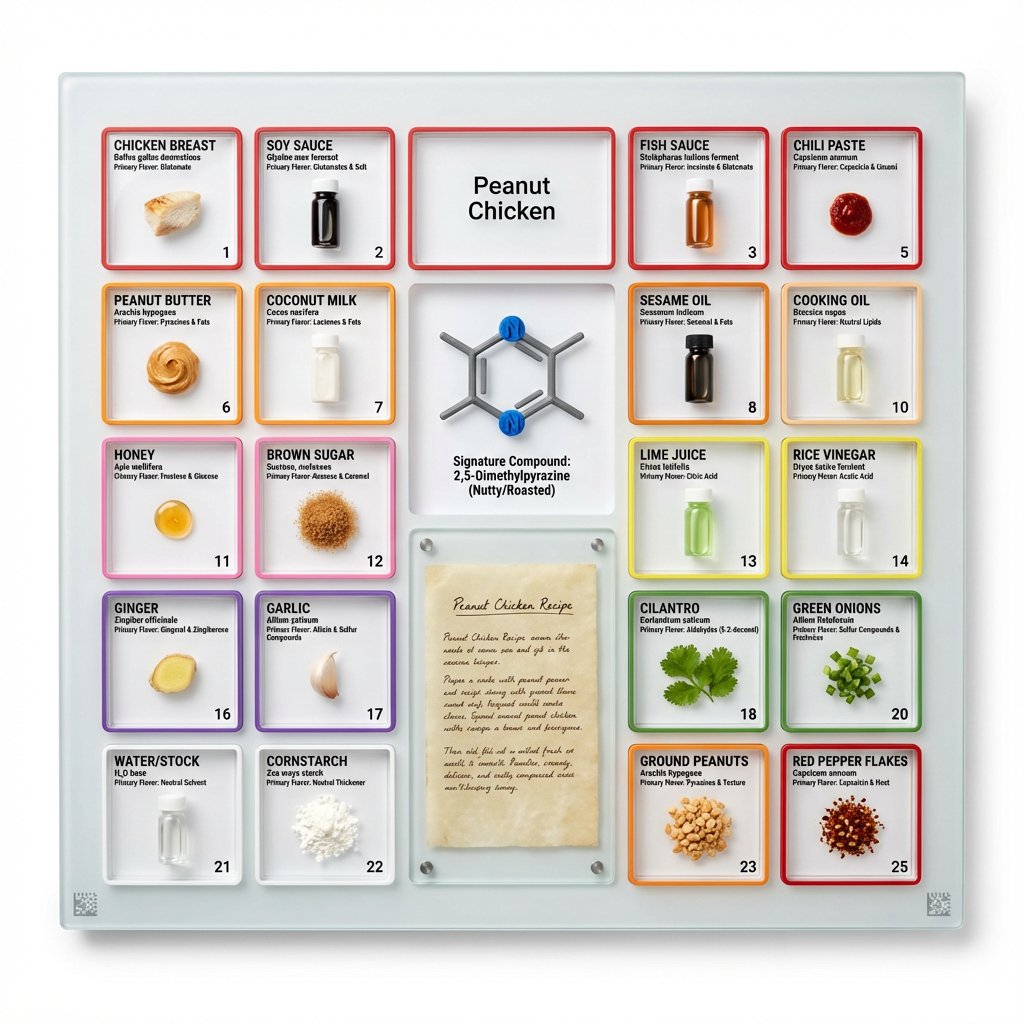
<instruction> Input A is a famous dish (photo or dish name). Analyze the dish's complete ingredient breakdown, primary flavor compounds, chemical interactions, and scientific basis for why ingredients work together. Optional Input B is a style reference (laboratory equipment / tech product packaging). If missing, choose scientific periodic table meets Apple product design aesthetic. Goal: Grid-format display board (20"x16") in periodic table structure, with each ingredient in its own compartment labeled with both culinary and scientific information, color-coded by flavor profile. Rules: Brushed aluminum, white acrylic, or frosted glass backing 20-30 small clear compartments in periodic table grid layout Each compartment contains: ingredient specimen, common name, scientific name, primary flavor molecule Color-coded borders: umami (red), sweet (pink), sour (yellow), bitter (green), fat (orange), aromatic (purple) Center "legend" section: 3D molecular structure diagram of signature compound Lower corner: actual handwritten recipe on aged vellum or parchment under glass AR markers for scanning to see animated 3D molecule models Clean sans-serif typography (like Helvetica or Futura) Minimal design with generous white space Include atomic-style "numbers" for each ingredient showing ratio/importance Output: ONE image, 4:5 clean product photography style with soft shadows on pure white background </instruction>

Some prompts are collected from creators on X. Copyright belongs to the original authors.